Home
About Us
Mevlana Development Agency
Karaman Investment Support Office
Karaman
History
Geography and Transportation
Demography
Education
Economy
Culture and Tourism
Districts
Sectors
Agriculture
Food
Machine
Packaging
Energy
Tourism
Mine
Woodwork and Furniture
Invest in Karaman
Why Karaman?
Karaman Investment Areas
Important Projects
Investor Guide
Incentives And Supports
Incentive Licence Application Guide
Investment Legislation
Foreign Direct Investment in Türkiye
Document Center
Publications
Feasibility Reports
Karaman Photos
Contact
I Want to Invest
Contact Us
TR
EN
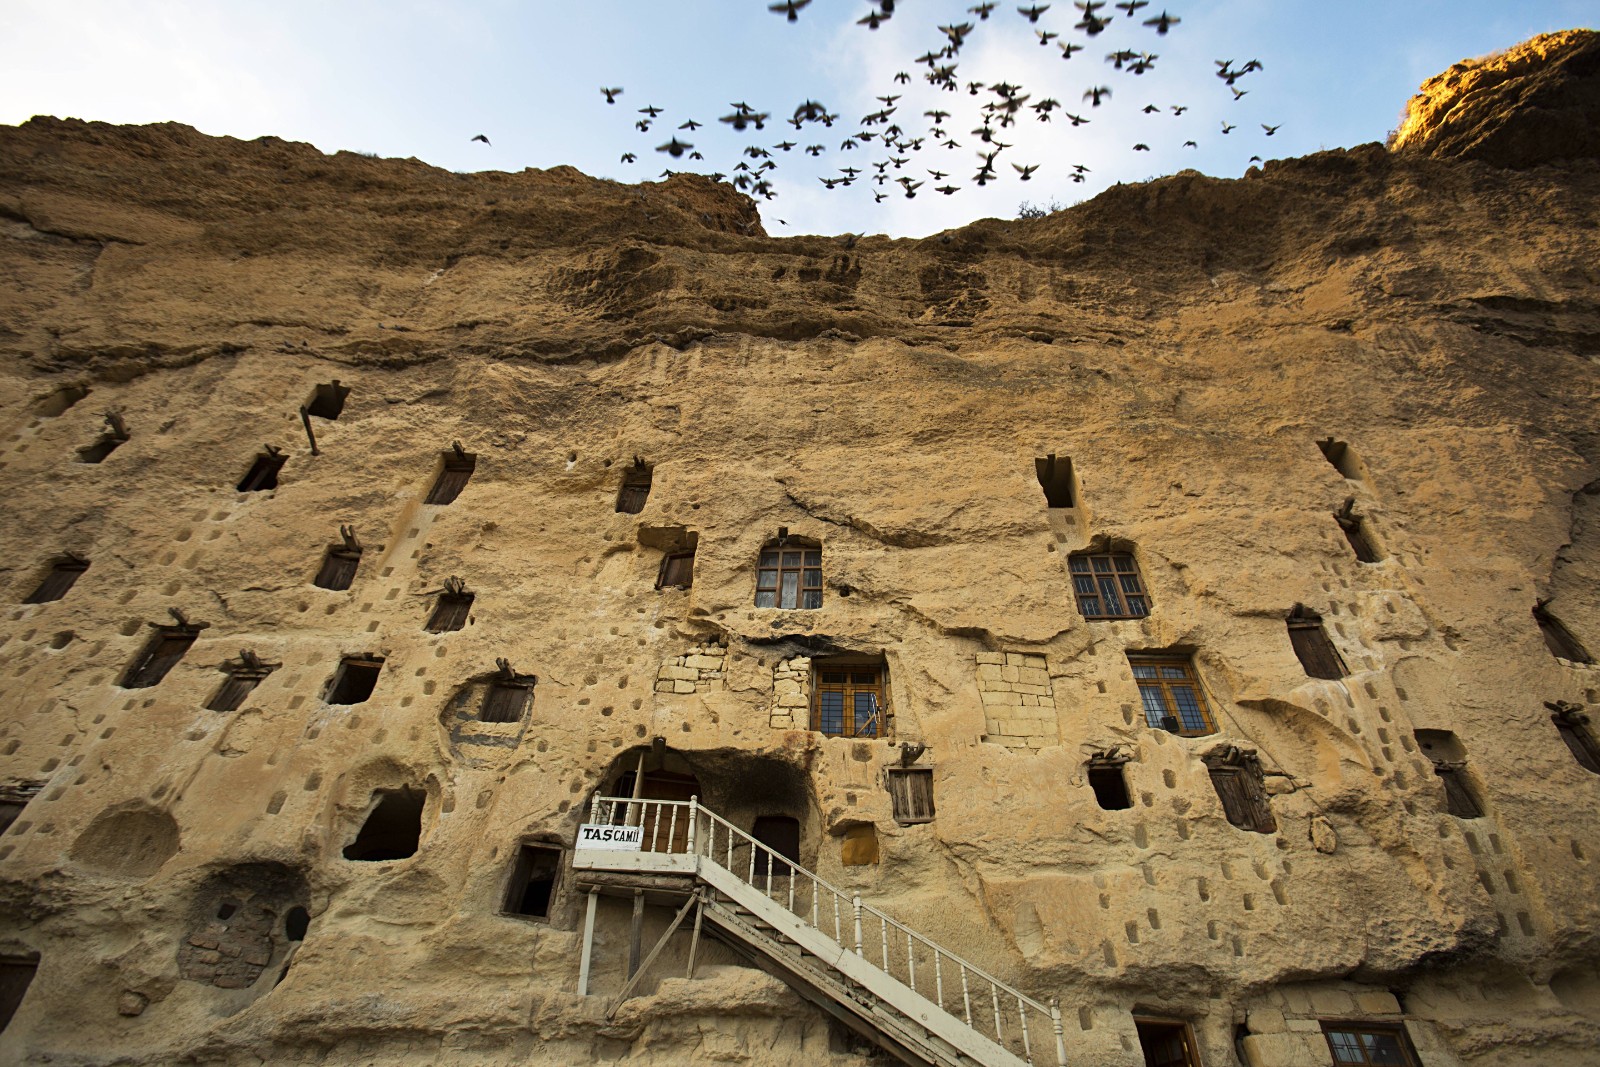
Rising Star in Tourism
Taskale Granaries
One of the Leading Province
In Agricultural Production
Fertile Lands
Karaman
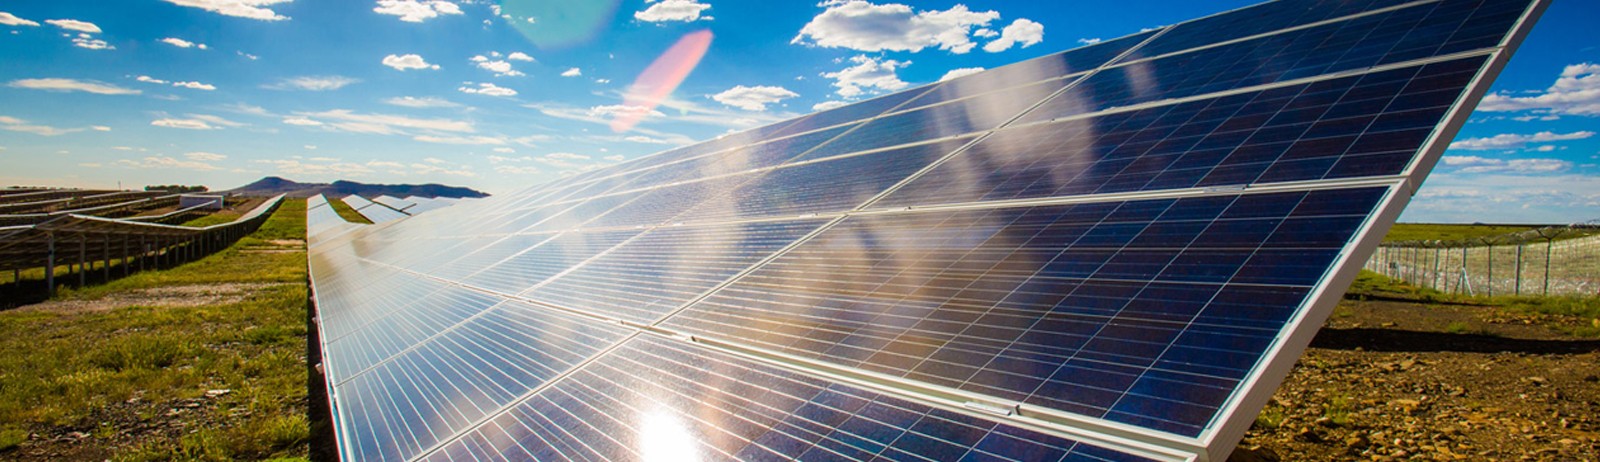
Renewable Energy Investments
New Base
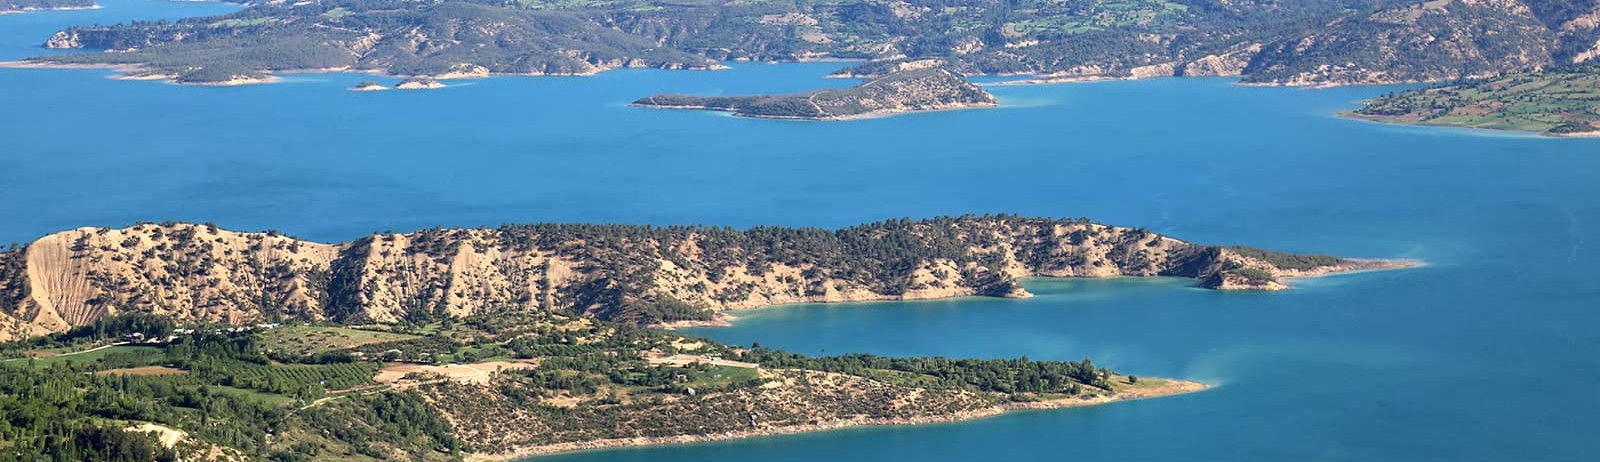
The City Growing with the
Energy of Water
Agriculture and Livestock Base
Karaman
All Government Supports
in One Portal
Incentive
Wizard
Investment
Pre-Feasibility Reports
All Government Supports
in One Portal
Incentive
Wizard
Investment
Pre-Feasibility Reports
Featured Figures
Prominent Statistical Data in Karaman Province
752
Thousand Tons - Apple Sector Center
Among the top 3 in production
1st
Biscuit, Chocolate Industry Base
35% of Sectoral Production
1.660
KWh/m2-year - Solar Energy Potential
Highest Sunshine Radiation Rate
1st
The Province with the Lowest Earthquake Risk
%7,5
Karaman is
Among the Provinces with the Lowest Unemployment Rate (2024)
45+
Company in Food Machinery Industry
Developing and Growing Food Machinery Industry
160+
Export to 160+ Country
$334 Million (2024)
News and Announcements
Applications Now Open for the Local Development Initiative Incentive Program
You are invited to Karaman Angel Investment Meeting Program
MEVKA Karaman Investment Support Office Analyzed Karaman's Industrial and Economic Situation
MEVKA Karaman Investment Support Office Researched Target Markets in the Apple Sector
ALL NEWS AND ANNOUNCEMENTS
TÜM DUYURULAR
TÜM İHALELER
Karaman Promotional Film
MEVLANA DEVELOPMENT AGENCY
Tweets by KaramanYDO